Viewing the Mapping Layers
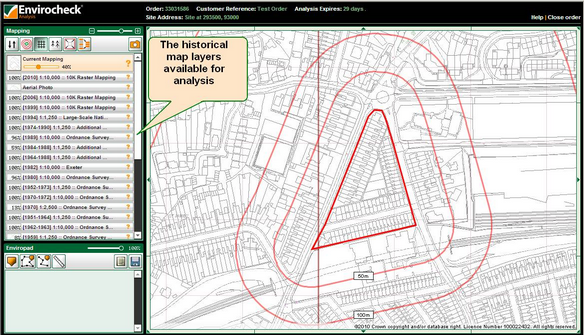
| 1. | Once in Envirocheck Analysis the historical maps purchased with the order will be displayed down the left hand side of the screen. The current mapping will be displayed in the main map window, with your site highlighted. |
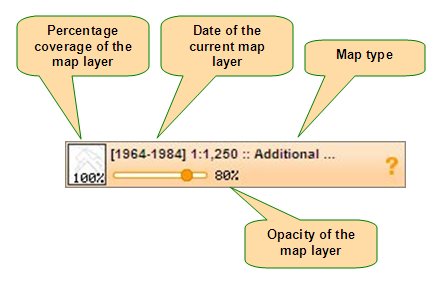
For each of the map layers the following information is supplied: The percentage coverage, the date, mapping type and the opacity:
| 2. | The maps are currently listed in ascending chronological order, however the order can be reversed by clicking the reverse layer sort order button located above the map list: |
| 3. | Your site of interest is highlighted, with 50m, 100m, 250m, 500m, and 1000m buffer indicators showing on the map. The toggle between 'No Site', 'Site' and 'Site+Buffer' button can be used to remove the highlight of your site and/or the buffer indicators, and replace them again: |
| 4. | The grid lines in the main map window are displayed by default, however the show/hide grid button can be used to toggle these on or off: |
| 5. | The historical map legend can be viewed by clicking on the show map legends button: |
| 6. | By holding down the show overview map button an overview street map will be displayed of your site: |
| 7. | You can immediately see the map layers you have switched on by clicking on the show only active layers button. This will list the map layers you are currently viewing down the left hand side. Once viewing only the active layers, this button becomes show all layers button, and when clicked again will list all the map layers down the left hand side: |
| 8. | To view the other layers of mapping available, click on the map you would like to view down the left hand side to display it in the main map window. To turn a map layer off click on it again. You can view multiple layers simultaneously for comparison during your analysis: |
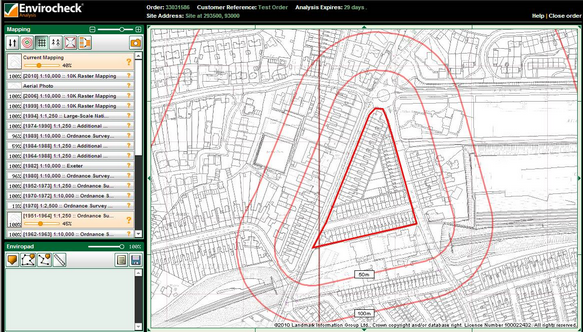
| 9. | The transparency of each of the active map layers can be adjusted using the opacity slider beneath the map layer name. This will allow you to make certain map layers more visible to aid your analysis: |

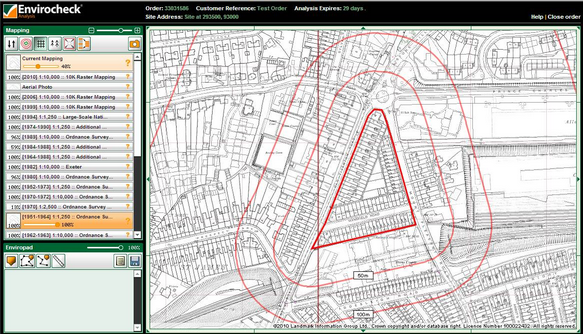
NOTE: As the transparency of a layer is increased, the shade of orange on the layer information bar on the left hand side decreases. As the transparency of a layer is decreased, the shade of orange on the layer information bar on the left hand side increases.
| 10. | Map layers can be made up of data from different tiles surveyed in different years, such as the example above. The date of this example is 1964-1984. A schematic is available to view to determine what parts of the map layer were surveyed in each year. To view the schematic for a map layer hover the mouse over the percentage coverage of the map to the left of the date: |
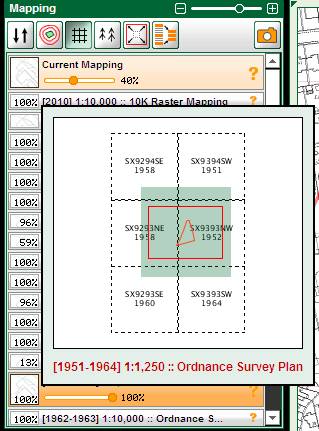
The green square on the schematic shows the extent of the map layer you have purchased. The red square shows how much of the map is currently being viewed in the main map window. For context, your site is also marked out on the schematic.
| 11. | Envirocheck Analysis provides the facility to track which layers have been analysed, or are of no use. By default, each new analysis access will have a question mark against all of the map layers to indicate they have not been analysed. By clicking on the question mark, it will change to a tick to indicate the layer has been analysed. By clicking on the tick it will change to a cross to indicate the layer is not useful as part of the analysis. By clicking on the cross, it will change back to the question mark. |


Next: Navigation

